Sunday, September 2, 2018

Cardiac Week

Cardiac Rhythms and Arrhythmias- 
Recognition

**Think about the causes and treatments for all of the following. Medications, interventions, etc.


Normal Sinus Rhythm:
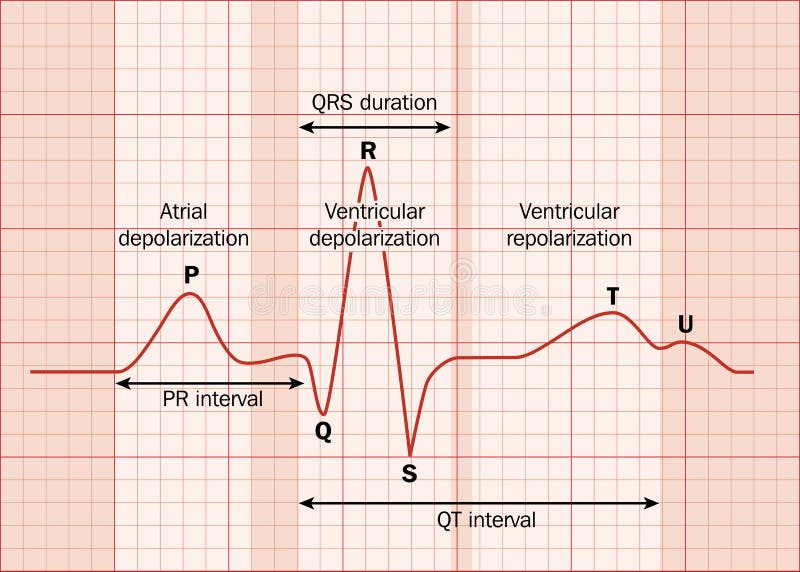
Rate 60-100bpm in adults, regular rhythm, p-wave present before every QRS complex


Sinus Bradycardia:
Rate less than 60bpm in adults, regular rhythm, p-wave present before every QRS complex


Sinus Tachycardia:
Rate 100-150bpm in adults, regular rhythm, p-wave present before every QRS complex


Atrial Fibrillation:
Rate is variable, irregular rhythm, difficult


Atrial Flutter: 
Rate is regular (can be fast or slow), regular rhythm.  Classic "saw tooth pattern"


Supraventricular Tachycardia: 
Rate >150bpm, regular rhythm, unable to identify p-waves due to high rate


First Degree AVB: 
Prolonged PR interval


Second Degree AVB
-Type 1 (Wenkebach)" Going, Going, Gone" or "Longer, longer, longer, drop, now you have a wenkebach".  PR prolongation leads to a dropped QRS.


-Type 2 (Mobitz Type II)PR interval is the same, however not every p-wave has a QRS complex following it.


Third Degree AVB (Complete Heart Block): 
This has complete av disassociation.  The p-waves have a regular rate, the QRS complexes have a regular rate, but they each march on independently of each other. 


Heart Blocks Made Easy (Ft. Taylor Swift)
Ventricular Fibrillation:
(fine or coarse)

Ventricular Tachycardia:


Torsades de pointes (polymorphic VT)


Asystole:
No electrical activity, flatline. Confirm in more than one lead.


Pulseless electrical activity (PEA): 
The electrical conduction system in the heart is still working, but the pump or mechanical system has failed.  The patient will have no pulse.

**Can be any of the above strips (except asystole) and the patient has no pulse.


Acute Myocardial Infarctions
Anterior Wall MI:
The anterior wall is affected by the LAD, Left main and circumflex arteries.  You will see ST elevations in V3 and V4 with reciprocal changes in inferior leads (II, III, avF). If lateral wall is involved you will see changes in V5 and V6 and if septum is involved changes are visible in V1 and V2.  This supplies blood to the musculature of the left ventricle and anterior -septum.
What type of arrhythmia would you expect to see?  Why? 
How would it be treated?
With our treatment, what would we be cautious of and why?


Inferior Wall MI:
The inferior wall is affected by the right coronary artery.  You will see ST elevations in leads II, III, aVf with reciprocal changes in leads V3 and V4.  It perfuses the SA node, AV node and proximal bundle of his.  
What type of arrhythmia would you expect to see?  Why? 
How would it be treated?
With our treatment, what would we be cautious of and why?


How are Acute ST- Elevation Myocardial infarctions diagnosed?

EKG! Should be done immediately, but must be done within 10 minutes of arrival.
What nursing interventions would you perform? Labs needed? Medications? Patient education?  


For additional Information:
This presentation explains STEMI's and focuses on the vessels affected as well as which ECG leads help diagnose.


This explains rhythm interpretation:


Thursday, August 30, 2018

How to Read a Rhythm Strip

Cardiac rhythm strips although they look daunting are actually quite simple if you read them in a systematic manner. Once you know what's normal, it is easy to figure out what rhythm the patient is in.  Let's follow some simple steps and figure them out together!


Download Heart ECG stock vector. Illustration of monitoring, science - 46354916
This is a diagram of the electrocardiograph. The waves and intervals are labeled in this picture.
Image Retrieved from: https://www.dreamstime.com/stock-illustration-heart-ecg-ekg-showing-major-intervals-created-adobe-illustrator-eps-image46354916


Now that we know the basic image we are trying to look at, we will follow a methodical step by step approach to figure out what rhythm we are looking at! On the ECG paper we usually print out a six second recording. Each small box is 0.04 seconds, each large box (5 small boxes) are 0.2 seconds. We need to know this for our interpretations. 

1. Is the rhythm regular or irregular?

For this you want to measure the distance between the r-waves (also called the R-R interval).  If the distance between consecutive r-waves is the same, the rhythm is regular.  If the distance is NOT the same, then we consider this to be irregular. 

Let's try it:
Would this rhythm be regular or irregular? (HINT: Check out the distance between the r-waves)

Answer: The distance between the r-waves is the same, this is a regular rhythm.
Image retrieved from: http://www.mauvila.com/ECG/ecg_fundamentals.htm


2. Is there a p-wave for every QRS Complex? Are they normal in appearance?
In a normal sinus rhythm the p-wave precedes the QRS complex.  They should be in a 1:1 ratio. 

Let's try it:
Does this strip have a p-wave for every QRS? 
Answer: Yes.  There is a 1:1 ratio between p-waves and QRS complexes. They are normal shape .
Image retrieved from: http://www.mauvila.com/ECG/ecg_fundamentals.htm


3.  What is the length of the PR interval? (normal is 0.12-0.2(Diehl, n.d.))

Let's try it:
What is the PR interval?
Answer: The PR interval is approximately 0.16. The start of the p-wave to the r-wave is approximately 4 small boxes on the strip, so 4 x 0.04=0.16 seconds.
Image retrieved from: http://www.mauvila.com/ECG/ecg_fundamentals.htm


4. What is the QRS complex measured at? It should be narrow, wide QRS complexes can be scary!  (Normal is 0.04-0.08 (Diehl, n.d.))

Let's try it:
What is the QRS complex measurement?

Answer: The QRS is approximately 1 small box. So, 1 x 0.04=0.4seconds.


5. What is the QT interval? (Normal is 0.36-0.44 (Diehl, n.d.))

Let's try it:
What is the QT interval?

Answer: The QT interval measures from the start of the QRS complex to the end of the T-wave. This is 8 small boxes, so 8 x 0.04 = 0.32.  This is a short QT interval.


6. Is is fast or slow? (We are using adults. Normal heart rate is 60-100)
Let's try it:
Is this rhythm fast or slow? 
(To do this you can use the "300 Method." Count the number of large boxes between 2 consecutive r-waves and divide 300 by the number of boxes.  You could also use the "1500" method where you count the number of small boxes between 2 consecutive r-waves and divide 1500 by the number of boxes (Diehl, n.d.)

Answer: There are 4 large boxes. 300/4=75. So this is approximately 75 bpm. This is a normal rate.


Putting it ALL Together!

We have a normal rate and rhythm. There are p-wave for every QRS. The p-waves are upright and normal shape. The intervals are all within normal limits. Our QT interval is slightly short. This would be a normal sinus rhythm with a shortened QT interval.


TRY SOME ON YOUR OWN:

Image result for sinus bradycardia ecg
Image retrieved from: https://en.wikipedia.org/wiki/Sinus_bradycardia


Image retrieved from: http://www.rnceus.com/ekg/ekgst.html


Answers:
1. Sinus Bradycardia
2. Sinus Tachycardia
3. Normal Sinus Rhythm
4. SInus arrhythmia


Other Resources for this Lesson:

ECG's Made Incredibly Easy:

A YouTube video to explain for further clarification:

You could also explore the "ACLS Rhythm Videos" on YouTube. Use "ACLS Rhythm Videos" in the YouTube search query.


References
Diehl, D.S. (Eds.). (n.d.) ECG interpretation made incredibly easy (5th ed.). Philadelphia, PA: Lippincott Williams & Wilkins.